Which vision signals actually help robotic foundation models?
I ran a controlled fine-tuning ablation on a world model to test which explicit vision signals (depth, tracks, masks, centroids, shape) actually help. Depth-conditioned supervision improved next-latent prediction by up to 14.5% on a filtered 13-episode pilot, then collapsed with 100 unfiltered episodes. Other signals showed the same pattern with less intensity. The full writeup is also available as an arXiv-style paper.
How can a robot learn to understand the space around it? Not just detect objects or plan a path, but develop some internal sense of depth, shape, and motion that generalizes across tasks?
This is an open question in robotics and computer vision research right now. As more of the planning stack moves into neural networks, the way these models represent the physical world matters a lot. I wrote a bit about the broader landscape here, but this post is about a project I ran to try and probe this directly: what happens when you take a world model and train it to predict specific computer vision signals alongside its normal task? Does predicting depth make it better? Point tracks? Object shape?
I figured a classic ablation experiment would be really incisive in cutting out the noise around what modalities were valuable to these models. Same model, same data, same training setup. The only variable is which signal you add on top. With this, we can isolate the effect of each modality and see what actually helps in foundation model training.
Foundation
JEPA-style world models have become pretty popular for robotics planning. Perhaps the amount of JEPA-based models exceeds the amount of people that even understand JEPA at all. I certainly didn't! The core idea is that instead of predicting the next image, which wastes a ton of capacity on texture and lighting, you predict the next latent state. The model learns structure rather than pixels. This makes it naturally suited for action planning, where you care about what changes in the scene, not what shade of brown the countertop is.
Success
Success
Failure
Success
Success
Failure
Success
Success
Failure
Success
Success
Failure
When LeWorldModel came out as a new JEPA-based world model, I figured it would be a great candidate for this experiment. It's super compact at 15M parameters total and it's built around ViT-Tiny, roughly 7.6M params. That means it's small enough to iterate on freely with just my GPU. Being able to mess around with these models at a low investment is really vital for getting familiar with this field. No finetuning testbed for LeWorldModel seemed to exist, so I built one and released it so I could try lots of things across a wide scope.
The way LeWM works is that a ViT encoder processes each frame into a single 192-dimensional CLS token, and then a small transformer predictor takes a window of these tokens plus actions and predicts the next one. The whole future of the scene has to compress through that single 192-dim vector. This ends up mattering later.
A key factor in JEPA models is that they aren't human-decodable. LeWorldModel mentions a pixel decoder in the paper but doesn't actually provide one. This decoder would translate predicted latents back into actual images, which would show us what the model thinks is going to happen.
JEPA, and LeWorldModel by extension, informs robotic actions very efficiently. It doesn't *generate* actions, but *given* an action it will it generate the next state as a latent. And because JEPA shirks human-friendly intermediate outputs, you can rifle through lots of candidate actions very quickly and use some scoring function to decide the best policy fast.
LeWorldModel has existing weights and datasets available. The pretrained checkpoint I used was OGCube, the task closest to the 3D spatial reasoning I wanted to probe. But one synthetic cube isn't exactly a demanding test of generalization. I needed a more formidable dataset.
After a fairly wide search of available robotics datasets, I landed on BridgeData V2.
BridgeData has real manipulation video of robot arms on all kinds of objects. Kitchen items, foods, containers, tools. It has 7-DOF action labels, gripper state observations, useful for detecting when the robot grabs something, and natural language task descriptions that I could filter on.
BridgeData has about 60,000 trajectories. To iterate efficiently, I built a weighted scoring system to filter for the best clips: task quality, prefer "put X on Y" and "pick up", penalize cloth folding, episode length, 15 to 40 frames is the sweet spot, track displacement, if nothing moves much, what are we even learning, mask quality, want 2 to 25% frame coverage with low temporal variance, and depth quality, want dynamic range above 2.0. For my own larger set, I selected 100 episodes randomly from the entire dataset. From those, I used this scoring system to pick the 13 highest quality videos as a pilot set.
Data
The whole point of this project was figuring out how to actually distill individual CV signals and format them in a way that a world model could derive value from. I extracted several modalities and then trained the model on each one in isolation to see which produced the best finetune.
Masks. Silhouettes of the object being manipulated. Here's a tricky labelling trick: to annotate these at scale, I used SAM 3's text-guided mode with the prompt "object being grabbed by robotic arm." This kind of flexible labelling is one of the more powerful capabilities of text-driven segmentation models. The masks tracked pretty well across most episodes. I also generated dilated versions of the masks with different buffer borders to test whether strictness mattered.
Depth. A map of how far each pixel is expected to be from the camera. Generated per-sequence with Video-Depth-Anything, ViTS encoder. Per-frame relative depth maps, temporally consistent. I used a scale-shift-invariant L1 loss for training, so relative depth works fine without metric calibration. By that I mean that I can get away with the depth not actually being set to any particular metric scale.
You can notice in some clips that the estimated depth of the static background drifts slightly over time, which isn't ideal. A better depth model would fix this, but for now it was serviceable.
I also extracted masked depth, which is, uh, depth restricted to the area of the mask.
Point tracking. These trace how individual points on objects move across frames. It gives us a direct signal about motion, like where things are going and how fast. These were generated with CoTracker3 in offline mode. A 20x20 grid gives 400 tracked points per frame with visibility flags. I later built a foreground-biased variant that places about 60% of points on the object region, improving object coverage from roughly 5 to 47 visible tracks per frame.
Centroids. The center of our object. I generated these by backprojecting masked depth to 3D using camera intrinsics, averaging the 3D points. Isn't that actually kinda cool? The results looked great.
Shape descriptors. This is a compact standin for full 3D representations like point clouds, gaussian splats, or NeRFs. A 10-dimensional vector derived from the backprojected object point cloud: centroid xyz, PCA extents, spread ratios, depth range, and a visibility proxy. Designed to be small enough to not choke the model's bottleneck while still encoding something about position, shape, and orientation. Visualizing these got a bit weird. These were a bit messy but were a good way to prepare my pipeline to eventually handle those bigger 3D representations. If this doesn't make sense just forget about it.
I didn't get around to pose estimation but that would be my next signal to look into, probably with something like FoundationPose.
Structure
All extracted signals were packed into HDF5 files: pixels, actions, observations, depth, contact, tracks, track visibility, object masks, object centroids, and shape descriptors. I used HDF5 because it handles large heterogeneous arrays well and supports compressed reads without loading everything into memory. Good format for finetuning.
I used auxiliary heads to activate modalities during training. Every finetuned model starts from the same pretrained LeWM checkpoint. Every model trains on the same BridgeData clips. The only difference between conditions is the extra supervision head that's turned on alongside the normal next-latent prediction loss. The base model always sees RGB and actions. The auxiliary head just adds an extra gradient signal from the chosen modality.
- A: Baseline. No auxiliary head, just standard finetuning.
- B: Full-frame depth. Predict a 56x56 depth map from the CLS token, around 400K extra params.
- C family: Masked depth variants. Tight mask, dilated masks, 8px and 20px, and weighted full-frame with 5x boost on object pixels.
- D: Point tracks. Predict 400x2 displacements from the CLS token, around 135K extra params.
- E: Depth + tracks together.
- F: Centroid. Predict [x,y,z] from the CLS token, around 37K extra params.
- G: Shape descriptor. Predict 10D object geometry summary, around 37K extra params.
All auxiliary losses weighted at 0.1. Our training stack looked like: AdamW, lr=5e-5, batch 16, 20 epochs, bf16 mixed precision, 3 to 10 seeds per condition. I made some small encoding dimension changes to support the auxiliary heads, but the core LeWM architecture was kept intact.
This setup made the project a clean ablation. Same data, same base model, same optimizer. The impact of each extra supervision signal is isolated. If depth helps, it's because depth helped, not because we changed three other things at the same time. Nice!
As an aside, I must confess that I am a 3D vision researcher. I should note that this project was originally going to be a much more extensive look at explicit 3D representations for world model training. Gaussian splats, NeRFs, multi-view reconstruction, the whole deal. I have some ideas about how to make that work efficiently.
But I dropped that ambition halfway through. Not for compute reasons as you might expect, but because BridgeData has a fixed overhead camera. Explicit 3D reconstruction really loses its appeal when the camera isn't moving. Multiple frames from the same viewpoint give you the same point cloud twice. There's no novel geometric information frame to frame.
I could have used a zero-shot 3D generation tool like SAM3D to reconstruct a shape from a single frame. But I decided that if the experiment was going to be honest, I should save proper 3D experiments for a dataset with actual camera motion. Wrist cameras would be interesting for this. You could even have two wrists collaborating on one reconstruction, a la my earlier non-sequential SfM blogpost.
So for now I focused on more fundamental CV signals: depth, tracks, masks, centroids. The shape descriptor served as a bridge towards 3D without requiring multi-view data.
I'll still be able to reuse this entire finetuning and extraction harness for a future 3D experiment, which is nice. Finding the best way for explicit 3D to inform an implicit understanding of form and collision is still very much on my list.
Results: Pilot
On the curated 13-episode pilot, only the best clips, things looked genuinely promising:
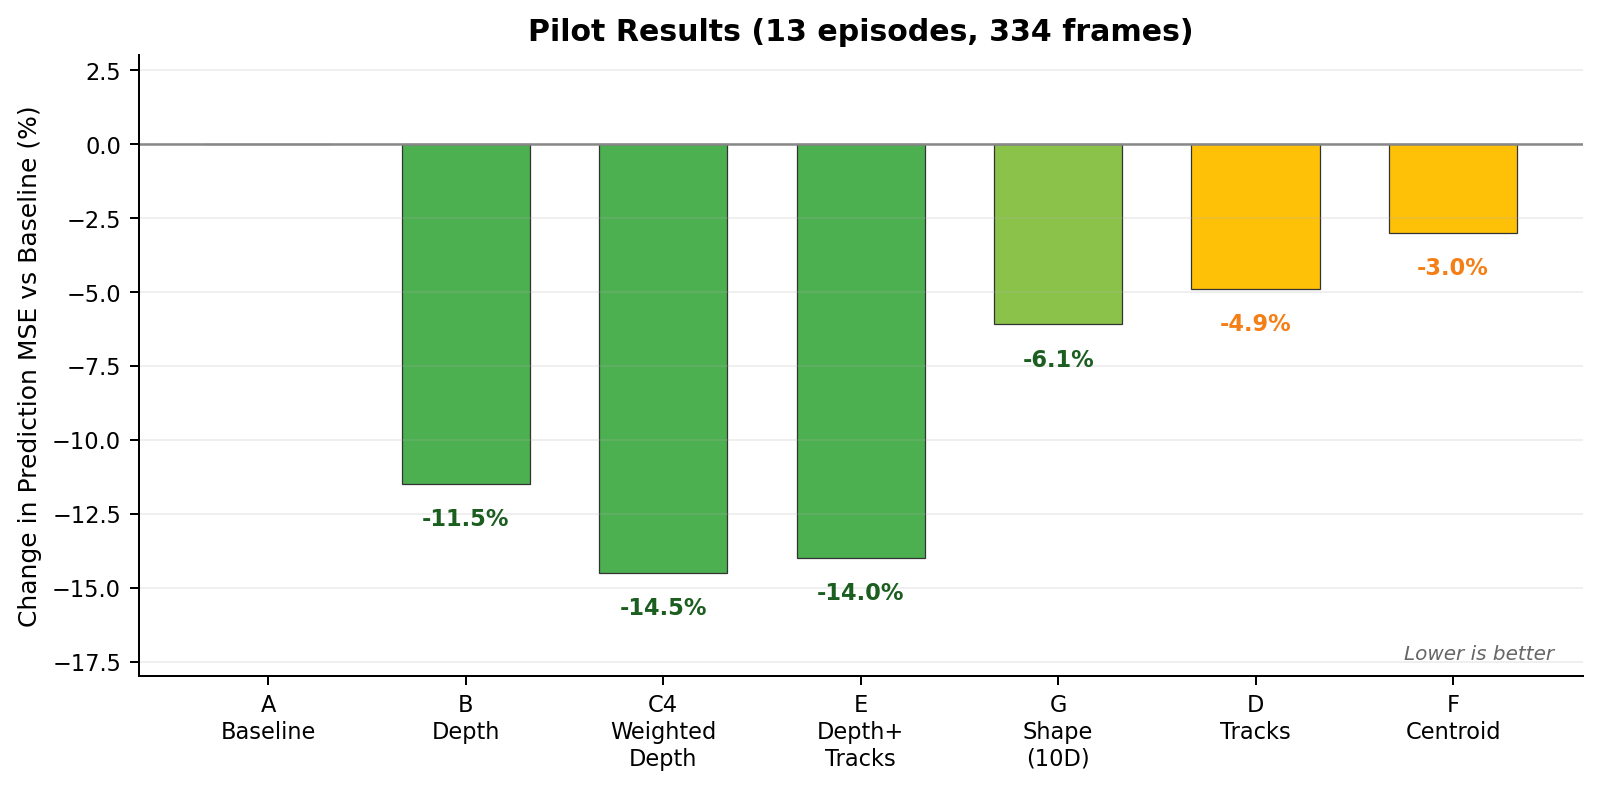
Depth worked great. Depth-based combinations were the strongest overall. The models genuinely beat the static baseline on episodes with clear object motion. This means they learned actual dynamics and spatial relations better. Woohoo!
Tracks were one of the more interesting results. The first round with a uniform grid of tracking points gave maybe 5 tracks actually on the object per frame. This didn't help, so I thought maybe the points just weren't landing where they mattered.
To attempt a fix, I built foreground-biased tracking: about 47 object tracks per frame. The tracks genuinely landed on the object and looked really good upon a visual audit, but the results remained middling.
This is actually a useful result because it tells you the failure is with the architecture instead of the data quality. A single 192-dim CLS token cannot usefully encode 400 independent 2D displacements through a flat MLP. The architecture can't handle it.
I've recently seen other research that had much better results with point tracks using a fundamentally different approach. Their model treats each track as its own token with local visual features from a frozen DINOv3 backbone, plus explicit occlusion handling. They train with a diffusion objective on reparameterized point velocities, which focuses learning on motion dynamics rather than absolute coordinates. Tracks aren't dead as a concept for world models, but maybe they're dead in my CLS-only formulation.
The mask family sweep was surprisingly clean, at least in terms of what it tells me:
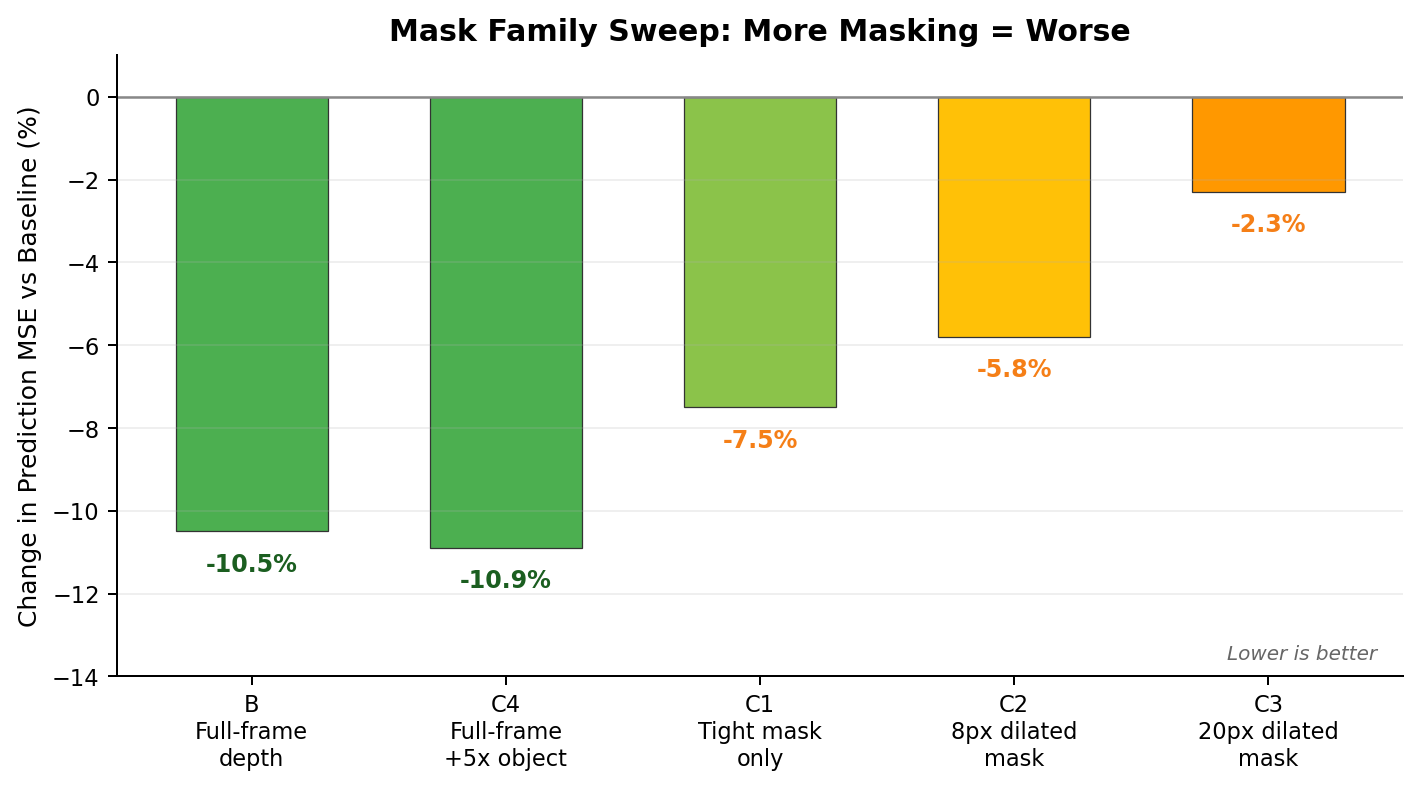
The pattern is monotonic. The more you restrict depth supervision to the object region, the worse it gets. The reason is the scale-shift-invariant normalization. When you normalize within a tiny masked region, around 2% of pixels, the scale and shift estimates become noisy. Full-frame normalization is much more stable. If you're using scale-shift-invariant depth loss, maybe you just shouldn't mask it.
Finetuning directly on the masks themselves, as a target signal, not just a crop boundary, could also be interesting but I didn't try it here. Maybe soon.
Results: Full Scale
For the full-scale run I focused on the most promising conditions: A, B, D, and E across 100 episodes, 2920 frames.
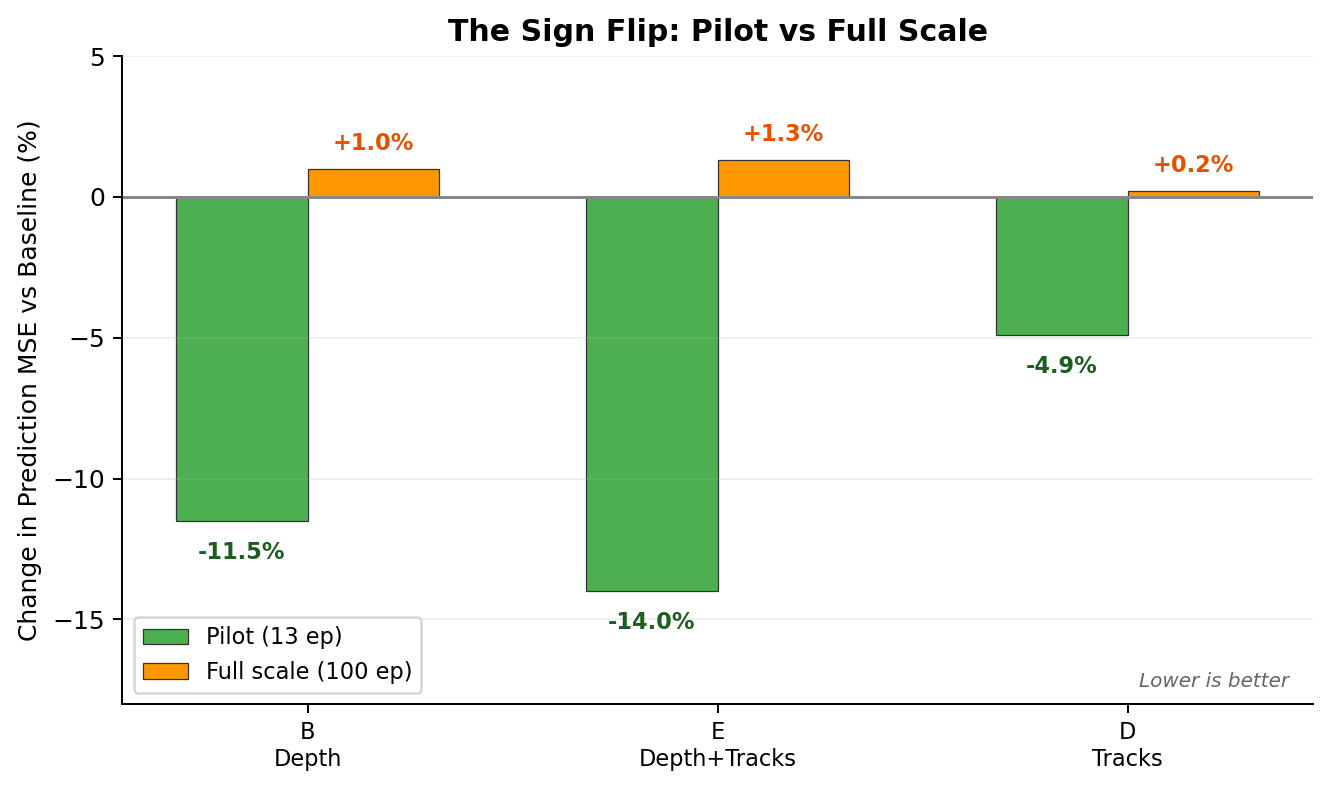
Dang. The advantages flipped signage. At 100 episodes, the extra supervision signals made things marginally worse. Absolute MSE dropped about 4x from pilot to full, which means the model had a lot more to learn from the larger dataset and didn't need the auxiliary crutch to get there.
This resonates with a recent finding from Hugging Face on finetuning Pi0 for shirt folding: algorithmic tweaks gave 5 to 20% improvement, but training on only the top 20% of data gave +50%. Data quality over quantity. In our case, the curated pilot was a high-quality dataset where every extra signal compounded. At full scale, the baseline just absorbed all of that through sheer diversity.
This is the main finding, which is that explicit auxiliary supervision acts as an inductive bias. On a small curated set, it fills in gaps the model can't learn on its own. On a broader set, the model learns the same structure implicitly and the auxiliary loss becomes noise. This makes our sign flip pretty clean: -14% at 13 episodes, +1% at 100.
Remember from earlier that LeWM compresses everything into one 192-dim CLS token for prediction. This actually explains a lot of the condition-specific results.
The ViT encoder produces that CLS token, but it also produces a full 16x16 grid of 196 patch tokens. These patch tokens carry spatial layout: where things are in the image, what's next to what. But the prediction path throws them away. Only the CLS token survives into the predictor. So every object, every spatial relationship in the frame, has to fit through that single 192-dim vector.
Once you see it that way, the results make more sense. Depth worked at pilot scale because "near versus far" is a global scene property. It's the kind of thing that can reasonably compress into one embedding. Point tracks failed because 400 independent (x,y) displacements are fundamentally local information, and a flat MLP from one global vector just can't reconstruct them. Centroid was too weak in the opposite direction: three numbers don't generate enough gradient signal to meaningfully reshape a 192-dim space. The takeaway is that "explicit 3D" isn't just about extraction quality. The model architecture has to be shaped to actually use the signal you're giving it.
Evaluation and Visualization
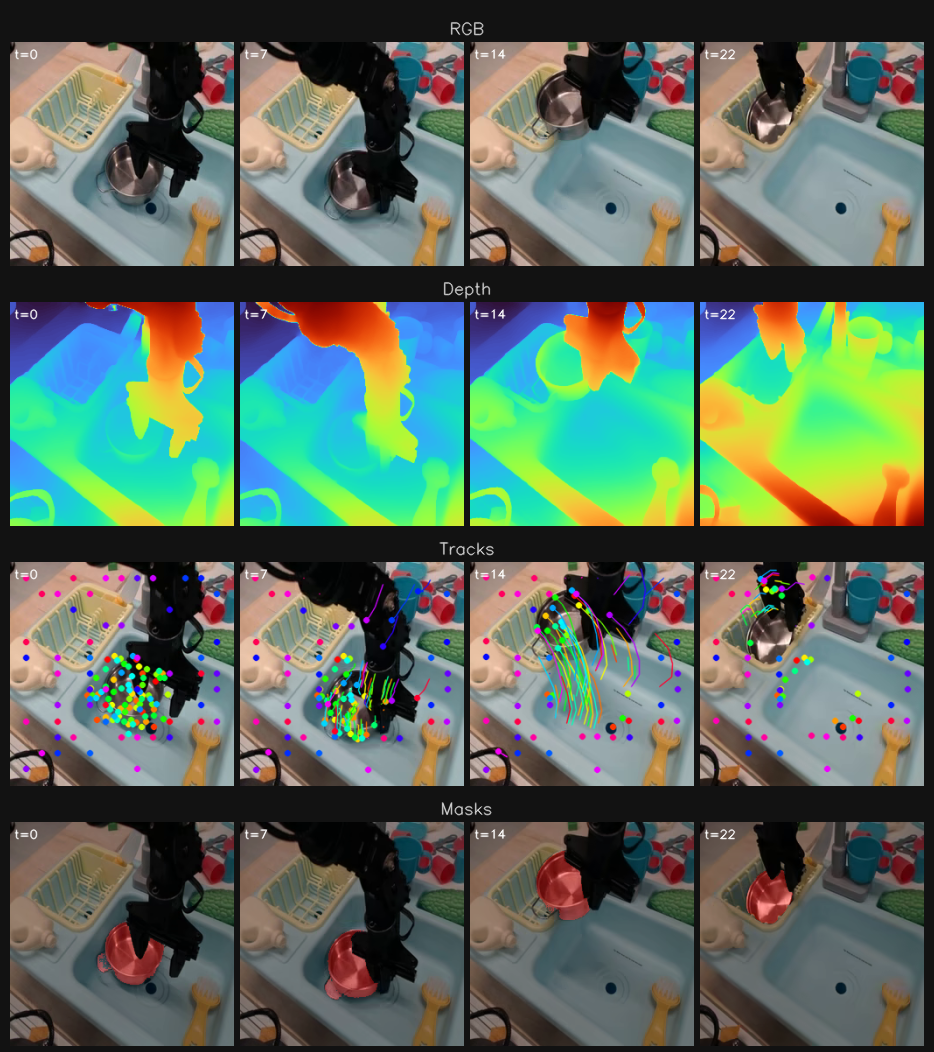
One of the biggest things I've learned in research is that when you're stuck, visualize the results as best you can to understand why. And then when you're presenting information to someone else, visualization is again vital to getting across what a system actually does. OFten the best thing I can do to understand a model is just click through lots of the training data to see what the model is seeing. So visualization of all sorts is a pretty central guiding light to how I do research. Graphs and metrics can tell me what happened, and displays can tell me why.
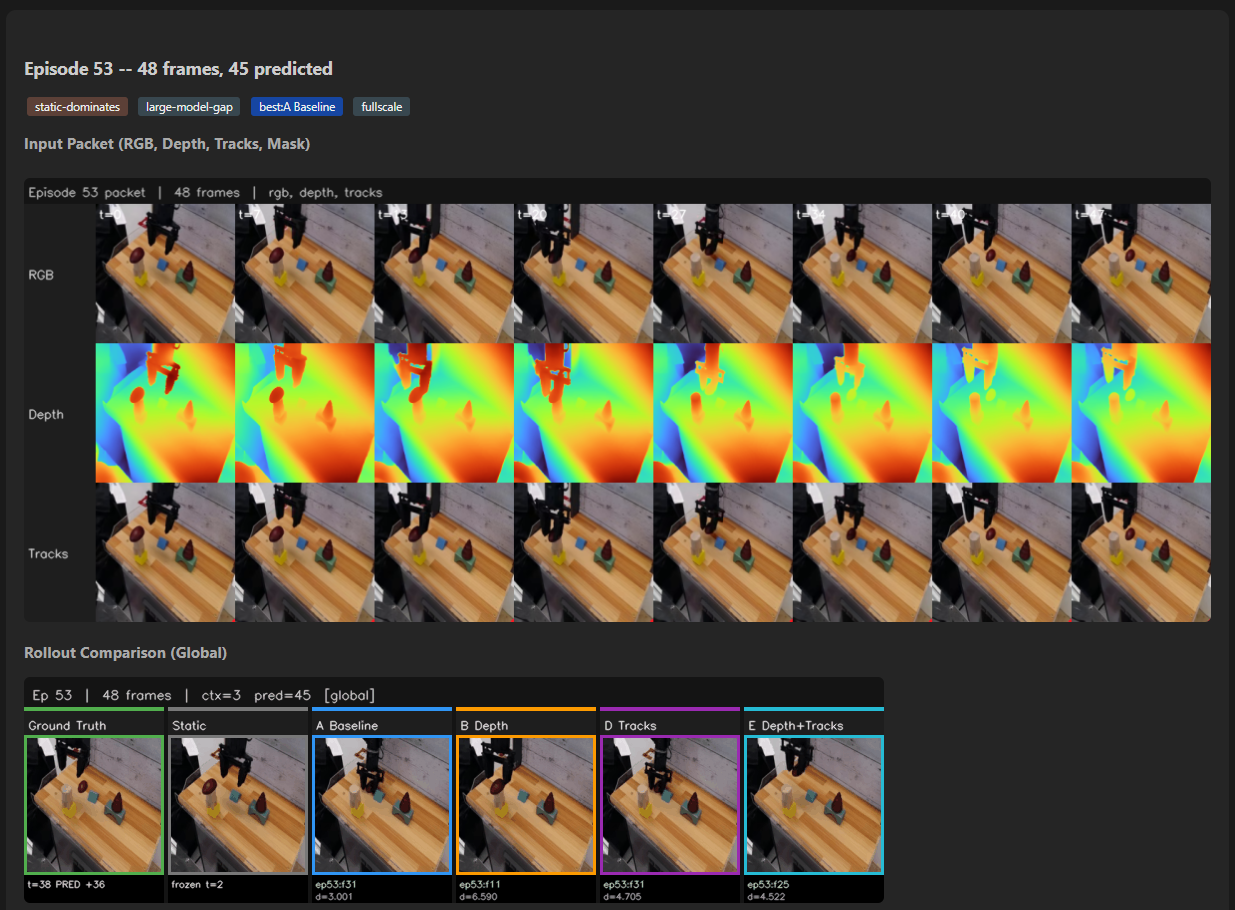
The packet viewer ended up being one of the smarter things this project grew into. For each episode I could inspect RGB, depth, track overlays, mask overlays, and object-only depth side by side. This stopped the project from being pure metric worship. When the visual audit showed depth looked plausible, tracks landed on the right objects, and masks were segmenting the right things, it meant that later negative results couldn't be blamed on broken extraction. The data was good. The model just couldn't use some of it.
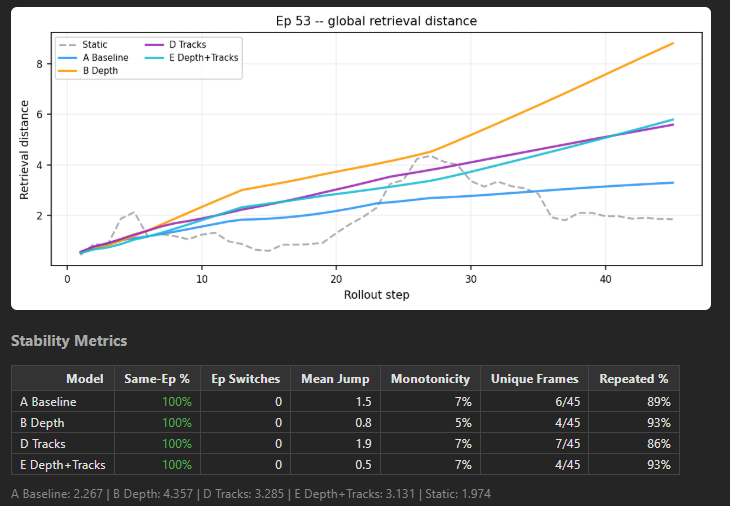
Since the model predicts latents and not images, I needed a way to actually see what it was predicting. I settled on a handy retrieval approach. For each predicted latent, search the entire dataset for the real frame whose latent is closest by L2 distance and then display that frame. If the model predicts a latent that's close to "frame 47 of episode 3," we show that frame. The retrieved image isn't actually what the model generated, but it reflects what the model's internal state looks like.
The retrieval rollout dashboards showed side-by-side GIFs of ground truth versus static baseline versus model predictions via this nearest-neighbor retrieval. Two retrieval modes: global search across all frames, honest but can sometimes show frames from other episodes, and same-episode search, smooth, restricts search to the target episode. I built auto-curation tags that labeled episodes as "static-dominates" or "models-beat-static" or "tight-tie" so I could quickly browse for the best examples. I like to use little QoL improvements like this when sifting through a bunch of episodes.
I tried to code a pixel decoder for JEPA but I just kept getting these results that looked like dementors. Since LeWorldModel predicts the next latent state instead of the resulting image, the model not producing human-legible outputs creates a fundamental tension in visualization. I tried training a cross-attention decoder to map latents back to RGB, but the results were patchy. It's been much easier to use the retrieval strategy where the predicted latent is matched to the most similar real image in the full reference corpus. Since visualization is so important and JEPA naturally resists human legibility, this retrieval approach has been huge in building an understanding of what the model is actually learning.
Looking Forward
There are a couple key limitations to go over before we wrap up here.
The videos are short. 3 to 10 seconds each. Long-horizon dynamics barely exist in this data. Even the full-scale set of 100 episodes is modest; this is a small-data to modest-data experiment, not a scaling study. The images are 224x224, all from the same overhead camera angle, in visually similar kitchen scenes. ViT-Tiny at 7.6M parameters is a small model. A bigger model might have enough capacity to keep benefiting from auxiliary signals even with more data. I am just one guy with one GPU but could probably do more.
I'm measuring latent prediction quality, not downstream task success. The real test would be whether better latents lead to better robot behavior. That's a harder experiment and I haven't run it. Full-scale only covered conditions A, B, D, and E. Not every condition got the 100-episode treatment. The depth estimation drifts on static backgrounds in some clips, which is a model quality issue that a better depth backbone would fix. And the CLS bottleneck is very specific to this architecture. A model that doesn't throw away spatial tokens might tell a completely different story.
A better RGB video -> monocular depth model could definitely help. You can see in earlier visualizations that the environment in our depth videos gets "warmer" as the arm itself moves around. The environment would ideally stay static in the depth estimation.
Multi-view or moving camera data would be super awesome to try. Wrist cameras, maybe. This would unlock proper Gaussian splatting and NeRF experiments. The original project vision requires it. I'm also thinking about how to make this work on web video, which is almost always monocular and mobile. The pipeline needs to handle both.
The tracks could be made better in a few ways. Trajectory tokens could help. Instead of predicting 400 displacements from one CLS vector, treat each track as its own token with local visual context. The literature suggests this works. It's a fundamentally different architecture and probably the right formulation for making tracks useful. Or maybe a patch-aware predictor could read the 196 patch tokens instead of just CLS. Then some spatially rich signals might actually get through the bottleneck. This would test whether the negative track results are about tracks being useless or about the architecture being unable to use them.
Conclusion
I built a LeWorldModel finetuning and 3D extraction testbed on real robot manipulation video. I tested which explicit vision signals help latent prediction. On a small, curated pilot, depth-based supervision gave real gains. On a broader 100-episode run, those gains disappeared or reversed. The auxiliary heads became noise generators the more data there actually was.
Beyond the specific results, the important thing has been gaining hands-on familiarity with world models, action planning, finetuning data pipelines, formatting large amounts of video, and scaffolding individual research projects. I look forward to using all of these skills more!